Analytics Settings
| Topic |
Detail |
| Navigation |
Admin → Contact Center → Analytics Settings |
| Purpose |
Configure abandon intervals and analytics capture settings for queue reporting |
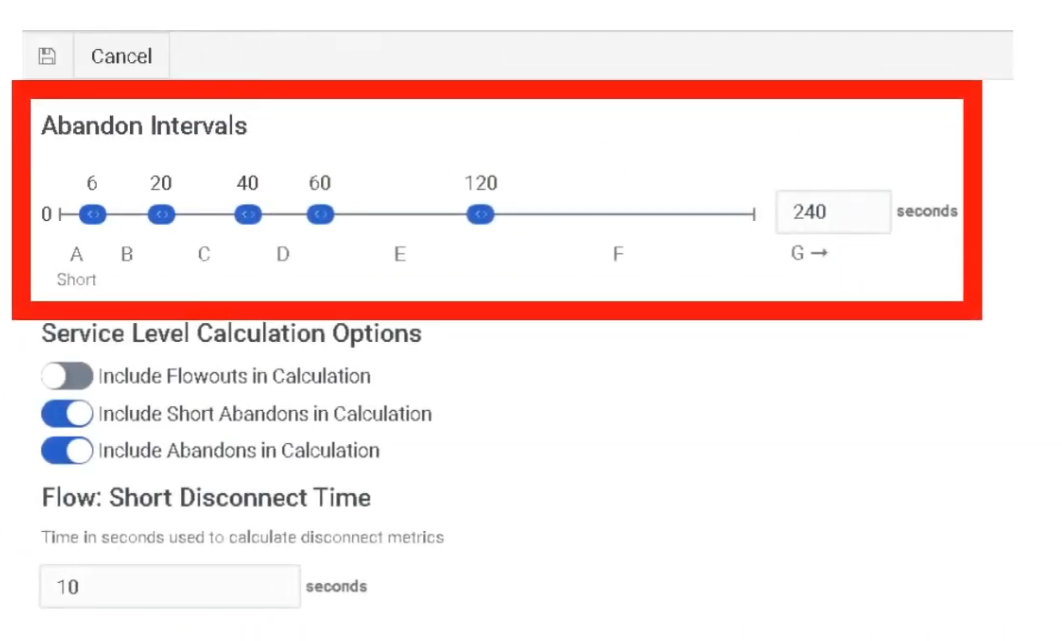
| Abandon Intervals |
7 configurable intervals (A–G) categorizing when customers disconnect from queue |
Overview
Analytics in Genesys Cloud transforms raw interaction data into actionable insights. Configuration here directly affects how abandonment is measured and reported across all queues.
Abandon Intervals
Abandon intervals measure how long customers waited in queue before disconnecting without reaching an agent. This metric helps identify queue tolerance, IVR issues, and staffing problems by grouping abandons into time ranges.
| Interval |
Default Wait Range |
Interpretation |
| A |
0–6 seconds |
Immediate disconnects — misrouting, robocalls, misdials, IVR confusion |
| B |
6–20 seconds |
Early abandons after entering queue |
| C |
20–40 seconds |
Short wait abandonment |
| D |
40–60 seconds |
Moderate wait abandonment |
| E |
60–120 seconds |
Customers leaving after ~1–2 minutes |
| F |
120–240 seconds |
Long queue wait frustration |
| G |
>240 seconds |
Very long wait abandonment |
⚠️ A large percentage in Interval A typically indicates misrouting, IVR confusion, or non-intentional calls — not a staffing problem.
Analytics Implementation Steps
| Step |
Action |
| Step 1 |
Set Service Level targets per queue — Admin → Contact Center → Queues |
| Step 2 |
Configure Abandon Intervals — Admin → Contact Center → Analytics Settings |
| Step 3 |
Ensure all queues have Wrap-Up Codes assigned so agents can tag interactions |
| Step 4 |
Create Dashboards at Performance → Dashboards with relevant KPI widgets |
Real-Time Analytics
| Feature |
Location |
| Performance Views |
Performance → Workspace — pre-built views for Queues, Agents, and Interactions |
| Dashboards |
Customizable screens with widgets for KPIs (Service Level, Agents On-Queue, Active Interactions, etc.) |
| Alerting Rules |
Trigger email or browser notifications when metrics hit thresholds (e.g., Wait Time > 5 minutes) |
Historical Analytics
| Feature |
Description |
| Standard Reports |
Pre-packaged PDF or CSV reports (e.g., Queue Abandonment Detail, Agent Log-level Report) |
| Dynamic Views |
Filter by date range, media type, wrap-up codes |
| Exporting |
Manual export or scheduled delivery to S3 bucket or email address |
Core Analytics Metrics
Interaction Volume
| Metric |
Description |
| Offered |
Total interactions entering the queue |
| Answered |
Interactions handled by agents |
| Flow-Outs |
Interactions exiting queue through routing or IVR actions |
| Connected |
Interactions successfully connected to agents |
| Metric |
Description |
| Service Level |
Percentage of interactions answered within SLA target |
| ASA |
Average Speed of Answer — average time before agent answers |
| Average Wait Time |
Average time customers wait in queue |
| Longest Wait |
Longest interaction currently waiting |
Customer Behavior
| Metric |
Description |
| Abandoned |
Interactions disconnected before reaching an agent |
| Abandon % |
Abandoned ÷ Offered |
| Average Abandon Time |
Average wait time before customer hangs up |
| Short Abandon |
Disconnects within a configured short-time threshold |
Agent Handling
| Metric |
Description |
| AHT |
Average Handle Time = Talk Time + Hold Time + ACW |
| Talk Time |
Active speaking time with customer |
| Hold Time |
Time interaction placed on hold |
| ACW |
After Call Work time |
| Transfers |
Interactions transferred between agents or queues |
IVR / Flow Metrics
| Metric |
Description |
| Flow Outcomes |
Where customers exit an Architect flow (Success vs. Failure) |
| Containment Rate |
Percentage of interactions resolved within IVR without reaching an agent |
| IVR Disconnects |
Customers disconnecting during IVR navigation |
Advanced Metrics
| Metric |
Description |
| Agent Utilization |
Percentage of agent time spent handling interactions |
| Concurrency |
Simultaneous digital interactions handled |
| Callback Rate |
Percentage of callers choosing callback instead of waiting |
| Recontact Rate |
Customers contacting support again after a recent interaction |
High Abandonment Troubleshooting
When investigating high abandonment, analyze these five together:
- ASA — Is average wait time excessive?
- Abandon Intervals — Which interval has the highest %? (Interval A = routing/IVR issue; Interval F/G = staffing issue)
- Service Level — Is the SLA target being met?
- Queue Staffing — How many agents are On-Queue vs. interactions waiting?
- Flow Outcomes — Are callers exiting the IVR before reaching the queue?

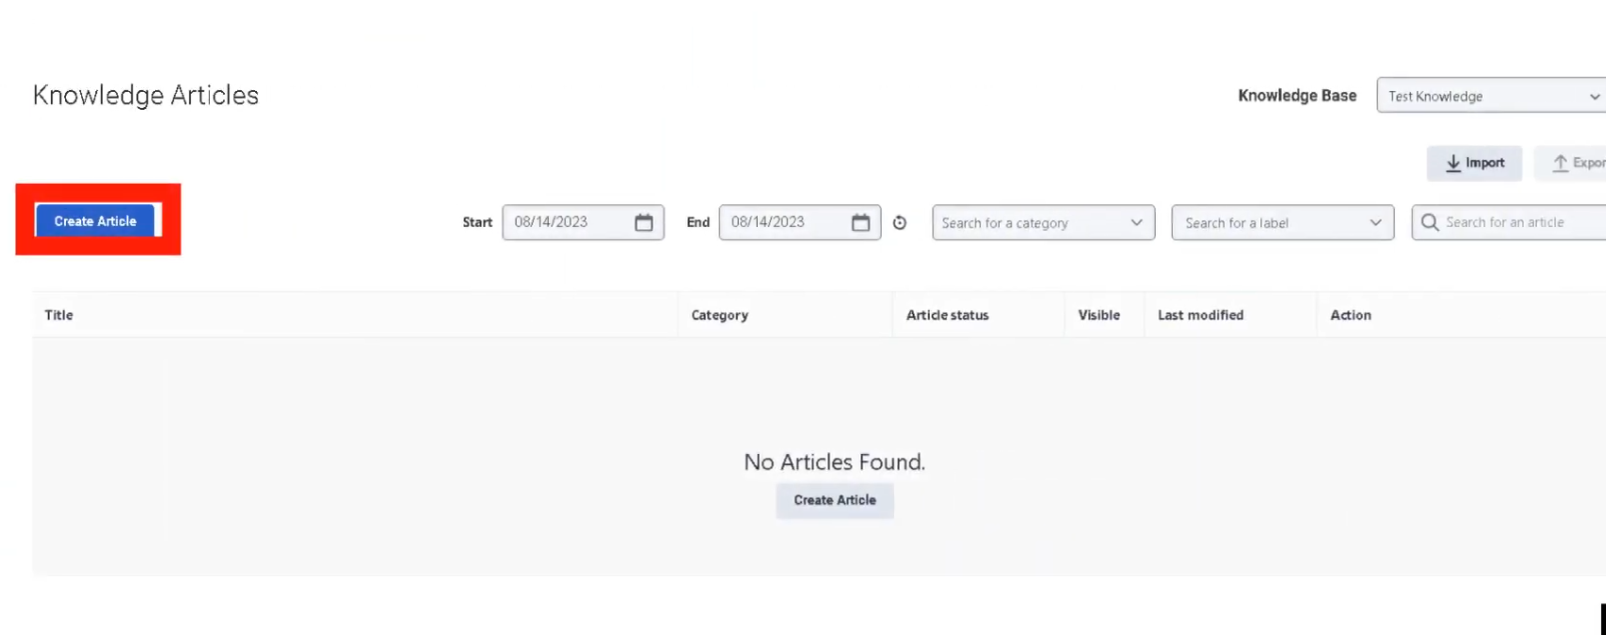
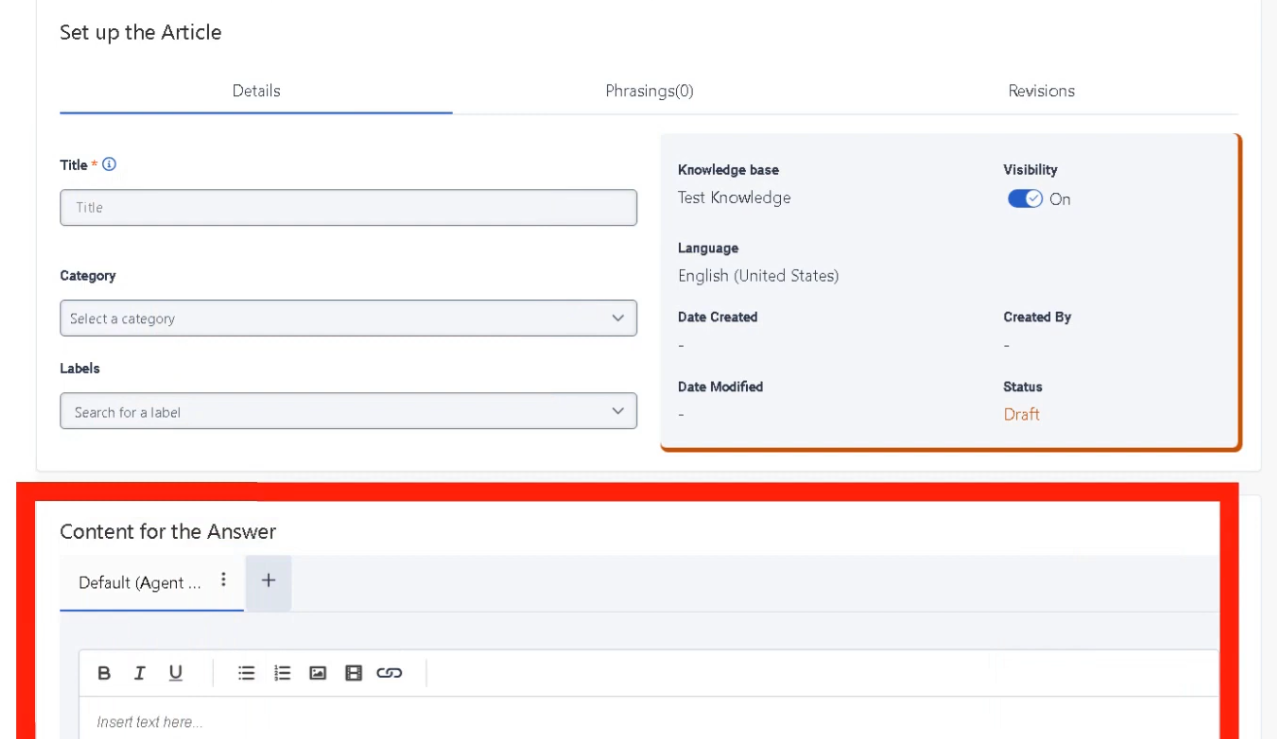
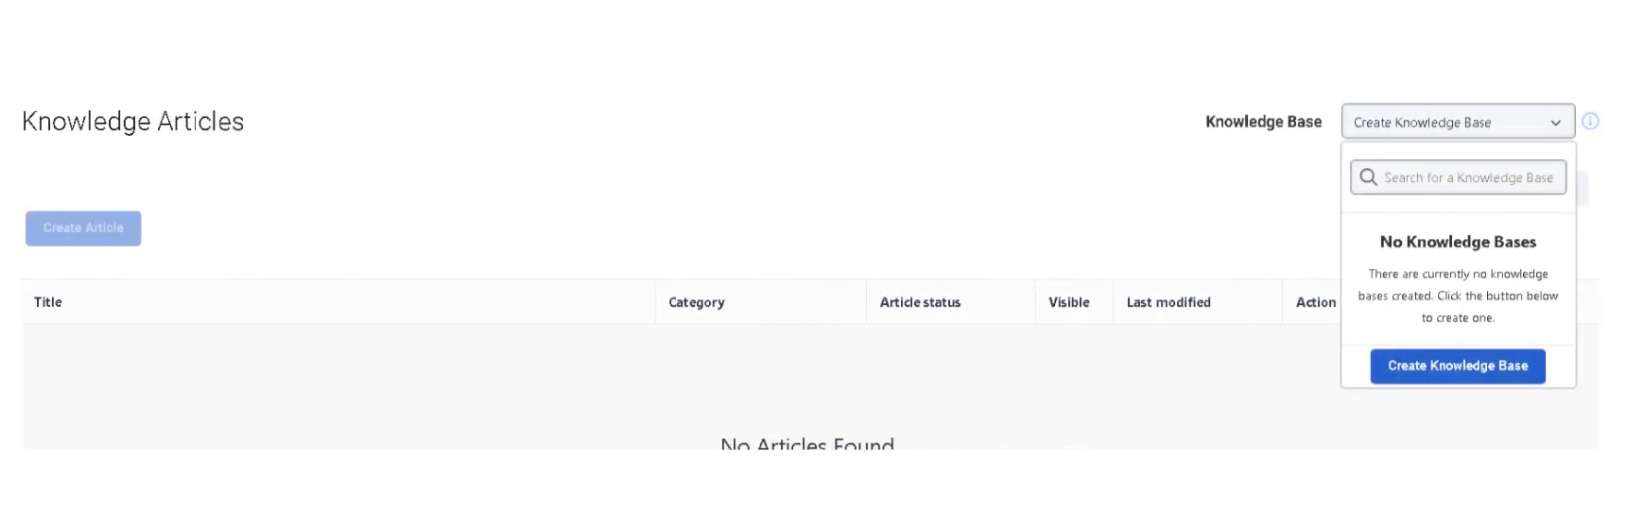
Knowledge Analytics
Knowledge Analytics measures how effectively knowledge base articles help resolve customer issues — for both agents and bots.
Search & Discovery
| Metric |
Description |
| Knowledge Searches |
Total searches performed in the knowledge base |
| Search Success Rate |
Percentage of searches that returned useful articles |
| Search Failure Rate |
Searches that produced no relevant results |
| Popular Search Terms |
Most frequently searched keywords |
Article Usage
| Metric |
Description |
| Article Views |
Number of times a knowledge article was opened |
| Articles Shared |
Articles sent to customers during interactions |
| Top Articles |
Most frequently accessed articles |
| Article Feedback |
Ratings or feedback from agents or customers |
Self-Service & Automation
| Metric |
Description |
| Knowledge Match |
Bot successfully finds a relevant knowledge article |
| Confidence Score |
AI confidence in the article match |
| Knowledge Fallback |
Bot cannot find a suitable article |
| Containment Rate |
Issues resolved through self-service without an agent |


Interview Cheat Sheet
| Question |
Answer |
| What do Abandon Intervals measure? |
How long customers waited before disconnecting without reaching an agent |
| What does high % in Interval A suggest? |
Misrouting, IVR confusion, or non-intentional calls — not a staffing problem |
| What is AHT? |
Average Handle Time = Talk Time + Hold Time + ACW |
| What is ASA? |
Average Speed of Answer — average wait time before an agent answers |
| What is Containment Rate? |
Percentage of interactions resolved in IVR without reaching an agent |
| Where are Abandon Intervals configured? |
Admin → Contact Center → Analytics Settings |


No Comments