Proxmox Monitoring Influxhdb2 and Grafana
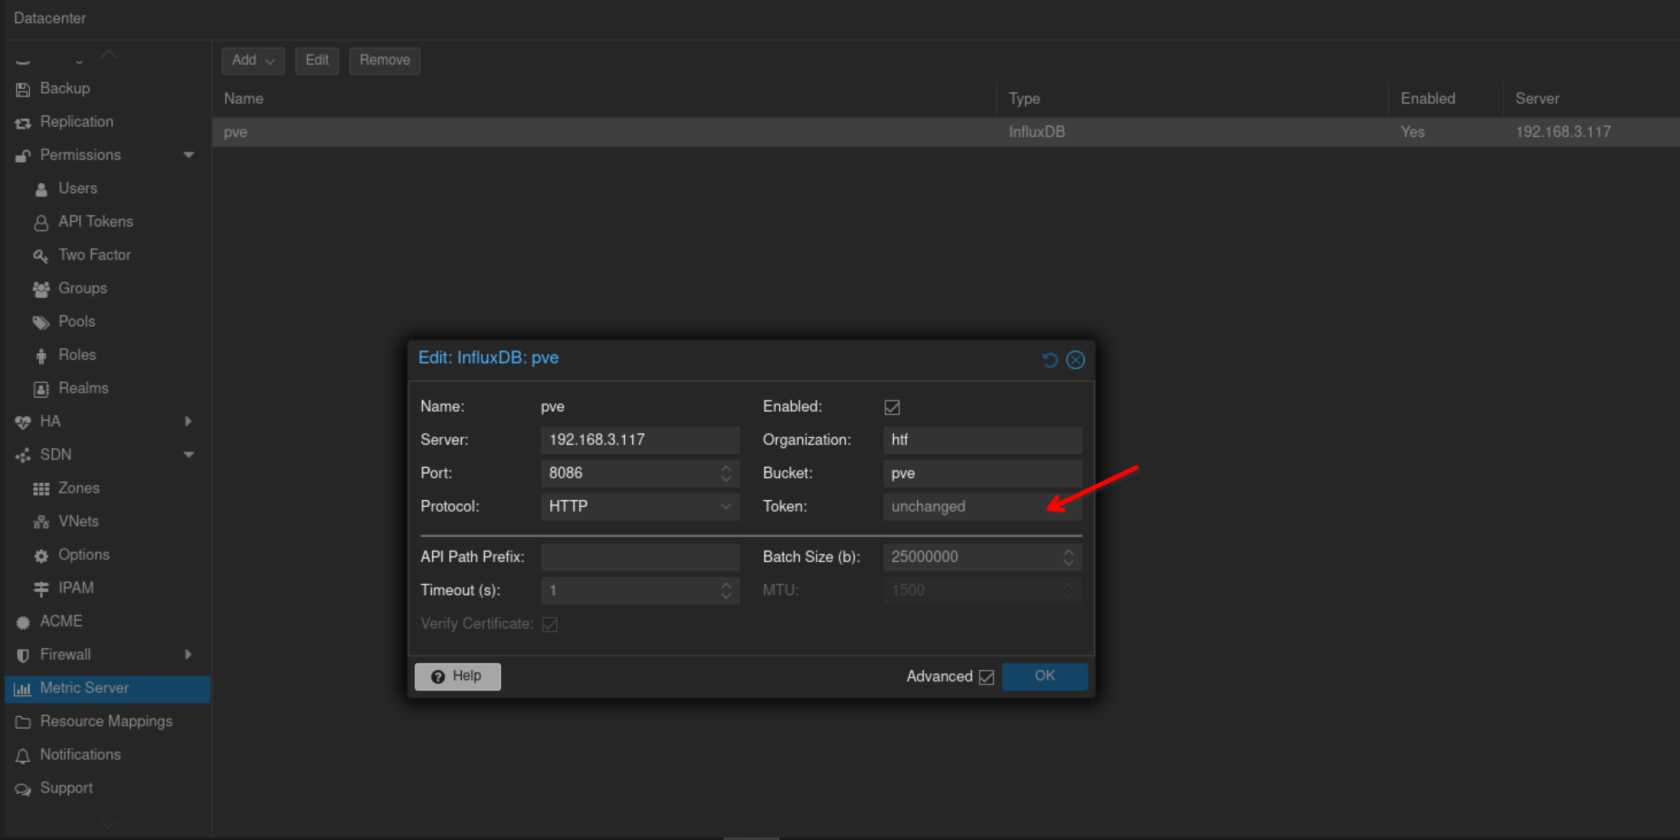
Add new metric server on proxmox, generate token from InfluxDB, make sure you get read/write access token API.
Make sure bucket and name patch, we are using organization htf and http port 8086

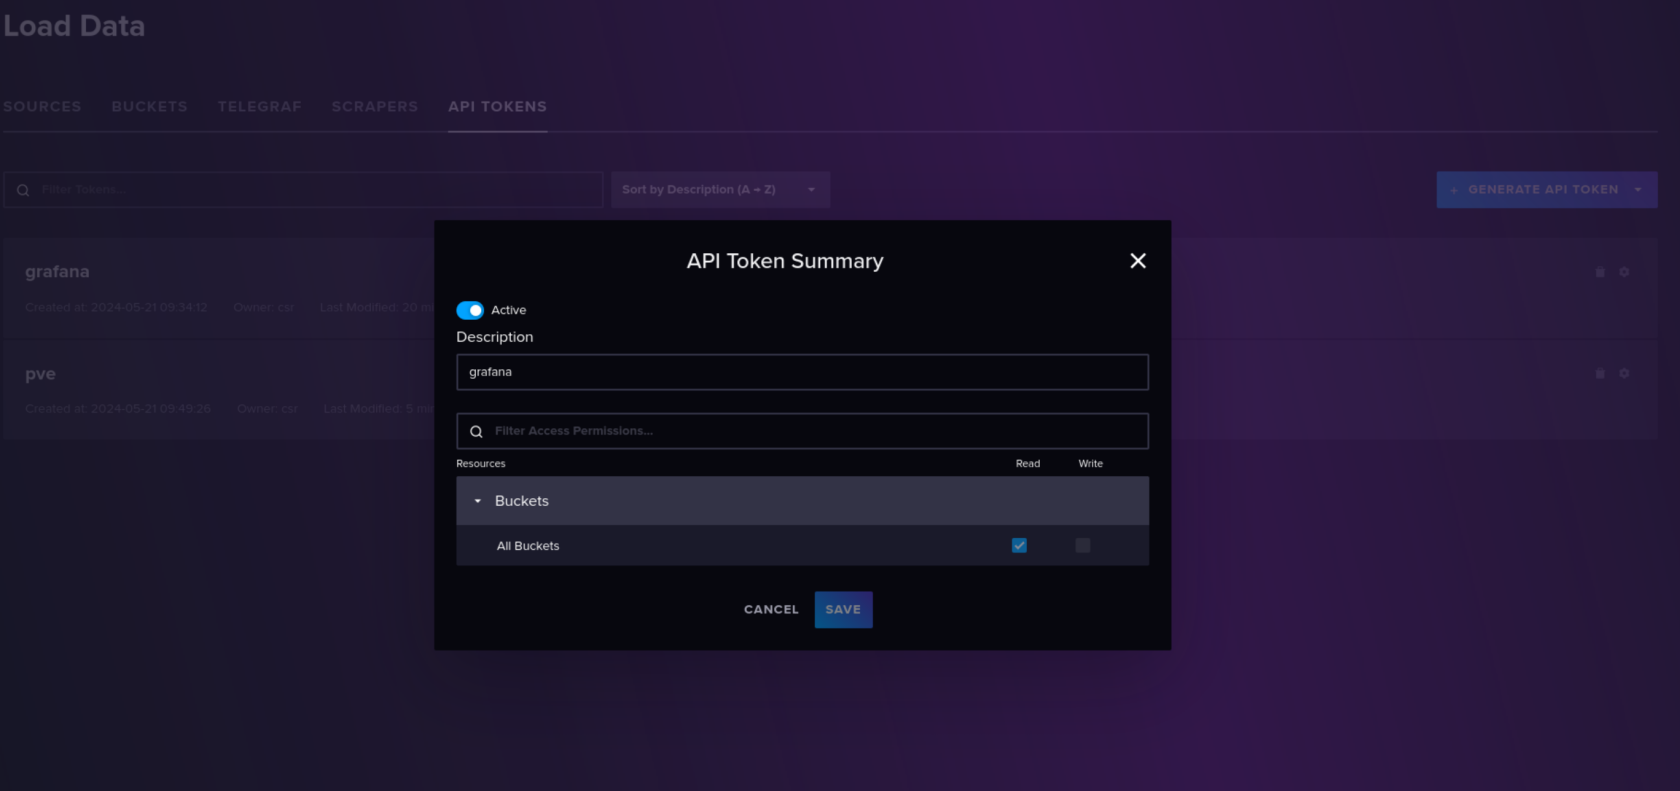
Create new API this time for grafana and give all read access to all buckets
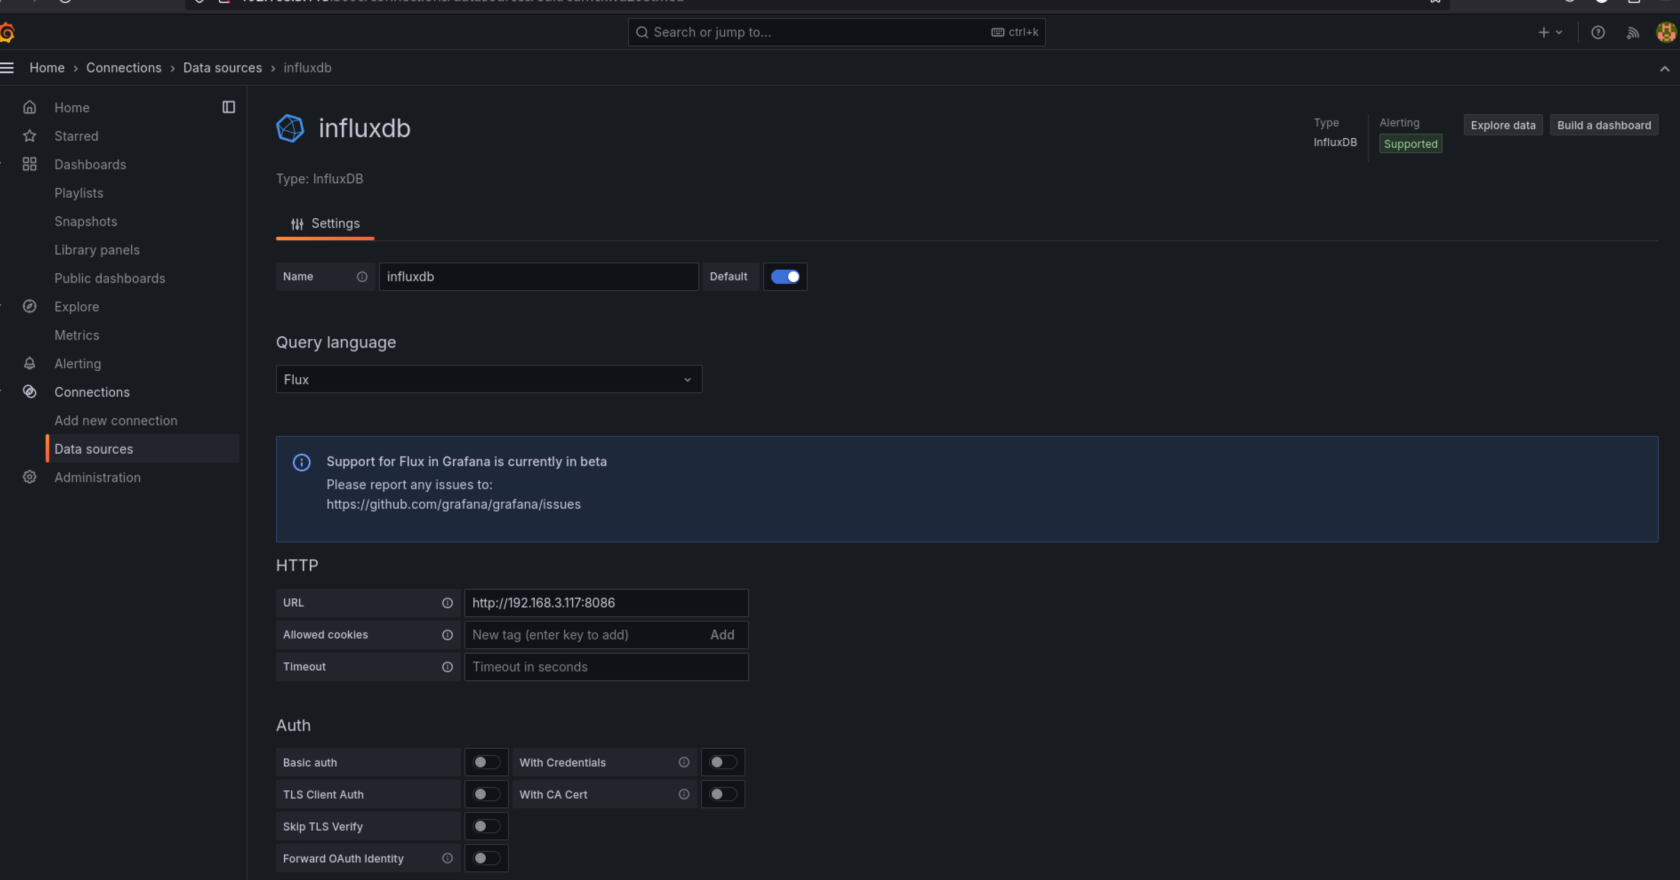
On grafana we will add a new source where URL IP is our Influxdb
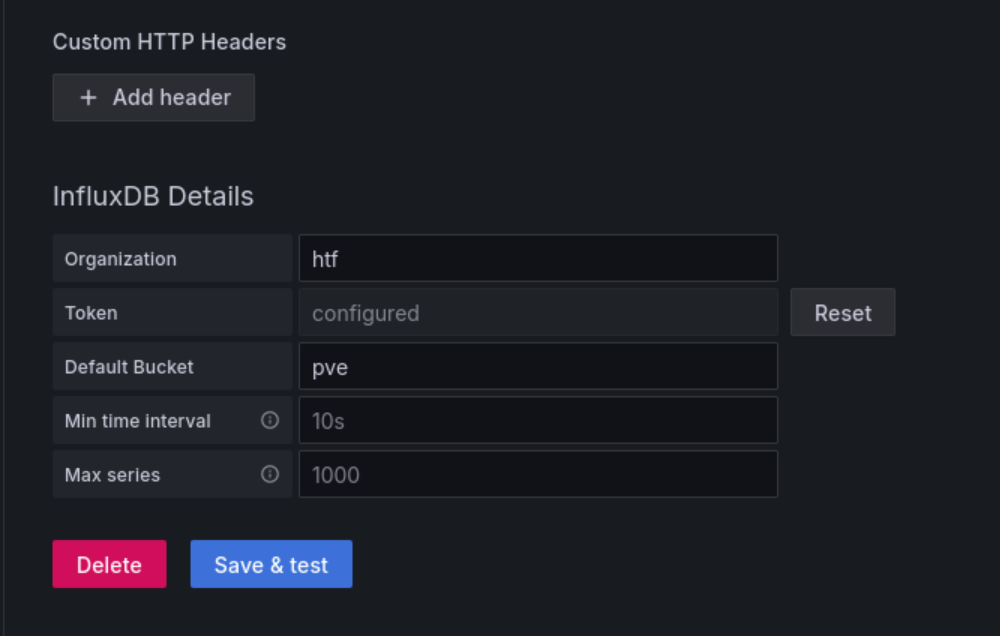
Save and test should work next we will add a new dashboard, we are using https://grafana.com/grafana/dashboards/17051-proxmox/?tab=revisions for our dashboard, copy code and import to grafana
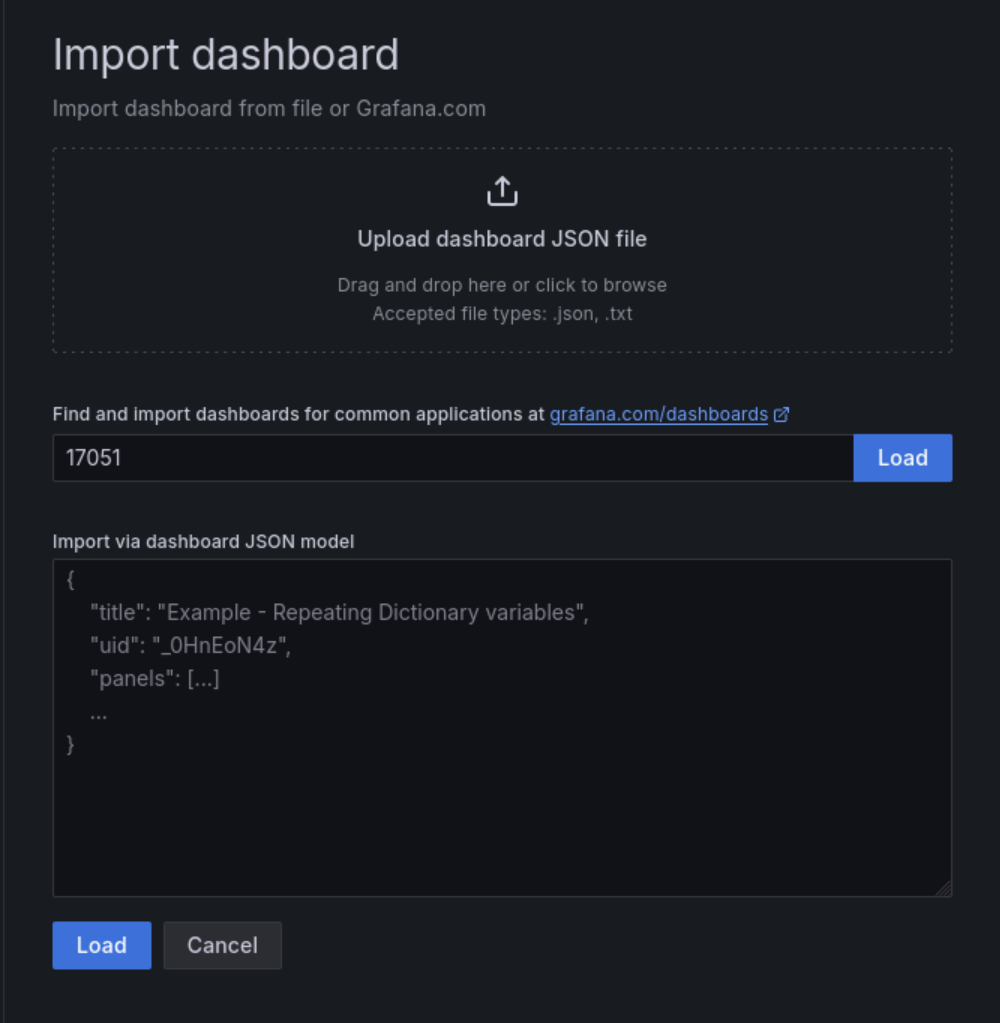
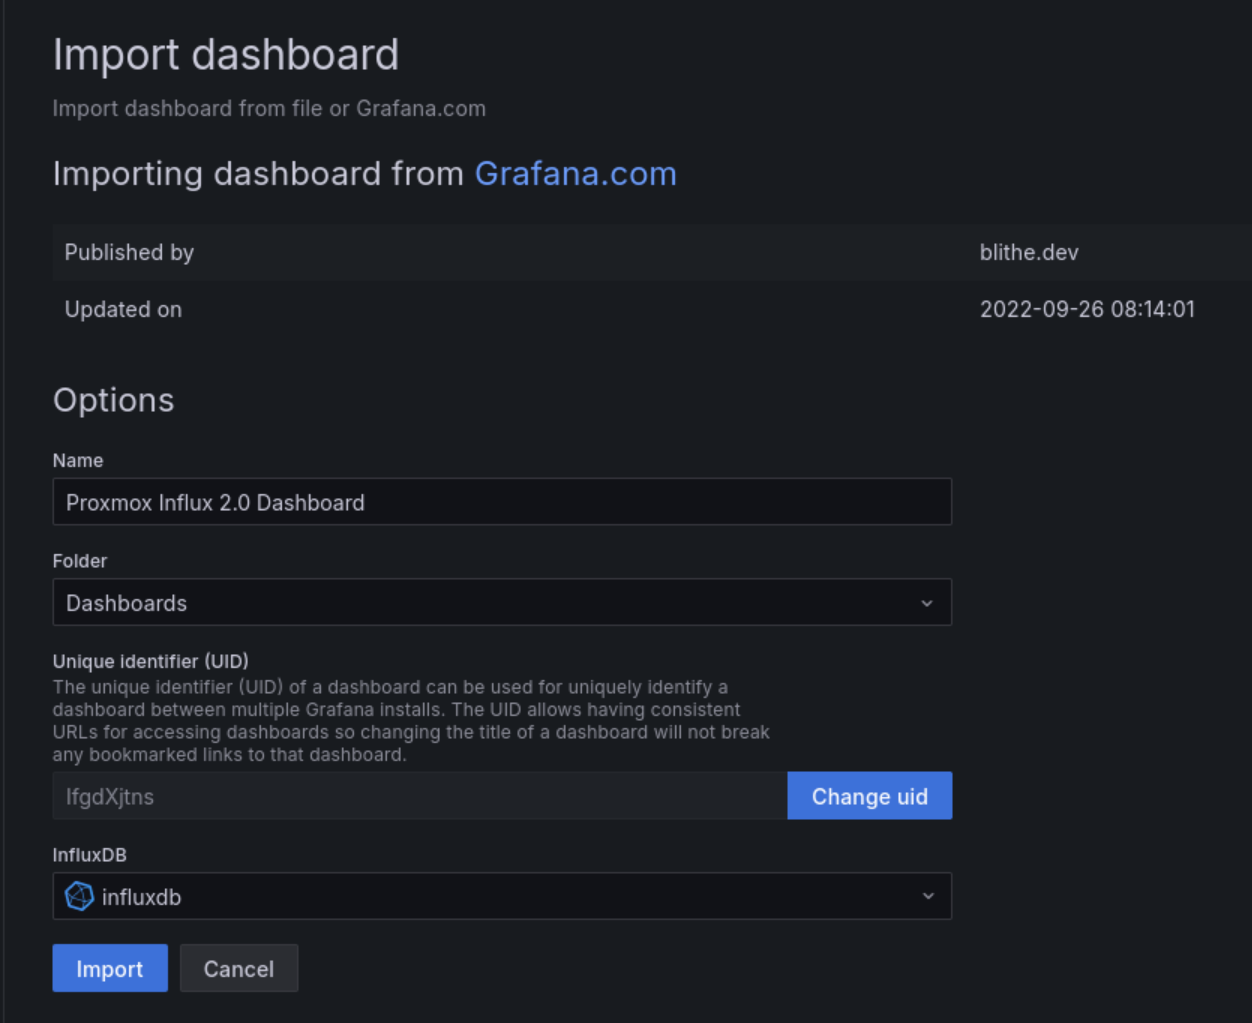
Select DB (Influxdb) give it a name and import
you can use the following command on Proxmox to view influxdb errors
journalctl -a | grep influxdb
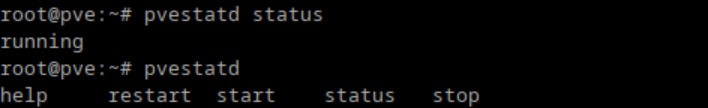
Also if no data is being sent make sure pvestatd is running on proxmox
No Comments