API Usage
Platform Usage | |
|
Study Notes
| Topic | |
|---|---|
Navigation
Admin → Platform Usage → API Usage |
|
Menu → IT and Integrations → API Usage |
|
| Navigation (Analytics View) | Performance > Workspace > Other > API Usage or Menu → Analytics → Analytics Workspace → API Usage |
| Purpose | Monitor API request consumption, identify high-volume clients, detect failures, stay within the Genesys Cloud Fair Use Policy |
OAuth > Client > View |
|
| Data Calculation | Daily aggregate — all requests 00:00:00–23:59:59 UTC |
| Dates display in |
✅ Verified against Genesys Cloud Resource Center — March 2026
Overview
Genesys Cloud provides two separate tools for monitoring API usage — the API Usage Report (Admin UI) and the API Usage View (Analytics Workspace). Both tools require the same permission, cover the same data sources, and exclude the same request types. This page covers both.
The API Usage report shows how many API requests your contact center makes and which clients generate those requests. If you exceed the Fair Use Policy for APIs, this report helps determine which clients make the most requests and which request types your organization uses most — allowing you to streamline API usage and avoid or plan for overages.
What Is Included
| Source | Included |
|---|---|
| Custom or third-party application integrations | ✅ Yes |
| AppFoundry applications | ✅ Yes |
| Data Actions calling the Genesys Cloud Public API | ✅ Yes |
| Embeddable Framework applications | ✅ Yes (subject to API usage allocations) |
| PUT, POST, GET, DELETE calls | ✅ Yes |
What Is Excluded
| Source | Excluded |
|---|---|
| Genesys Cloud browser, web, and mobile app internal requests | ❌ Not included |
| Outbound Data Actions calling external platforms | ❌ Not included |
| Genesys Cloud for Chrome | ❌ Not included |
| Genesys Cloud for Firefox | ❌ Not included |
| Genesys Cloud for Salesforce | ❌ Not included |
| Genesys Cloud for Zendesk | ❌ Not included |
API Usage Report — Dashboard Panels
Overview
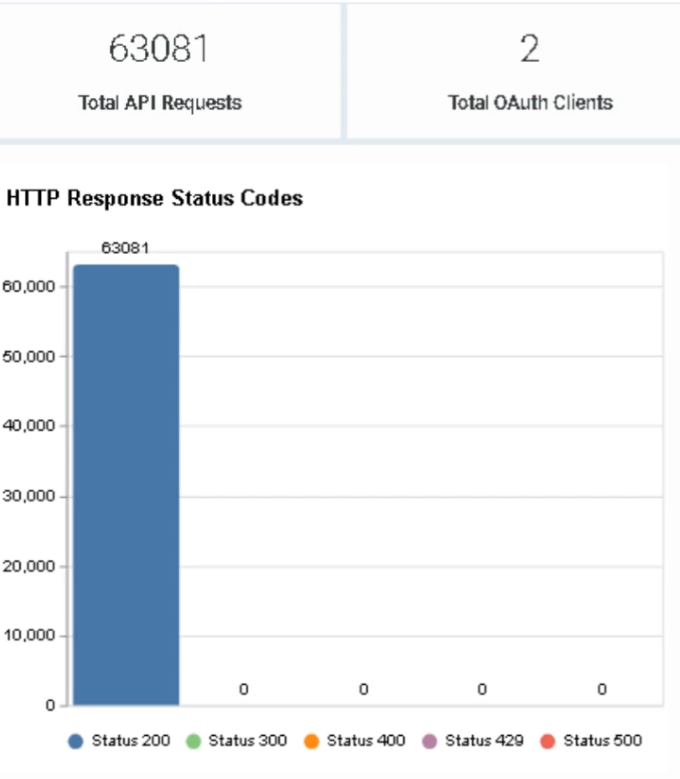
Overview
The API Traffic & Request AnalyticsUsage dashboard is divided into three main sections: Most Active Requests, providesOAuth aClient centralizedRequests, viewand URL Requests. Each section contains graphs and shows the count of howtotal APIsAPI are being used within the Genesys Cloud organization — request volume, client activity, endpoint usage,requests and responsetotal outcomes.OAuth clients.
![]()
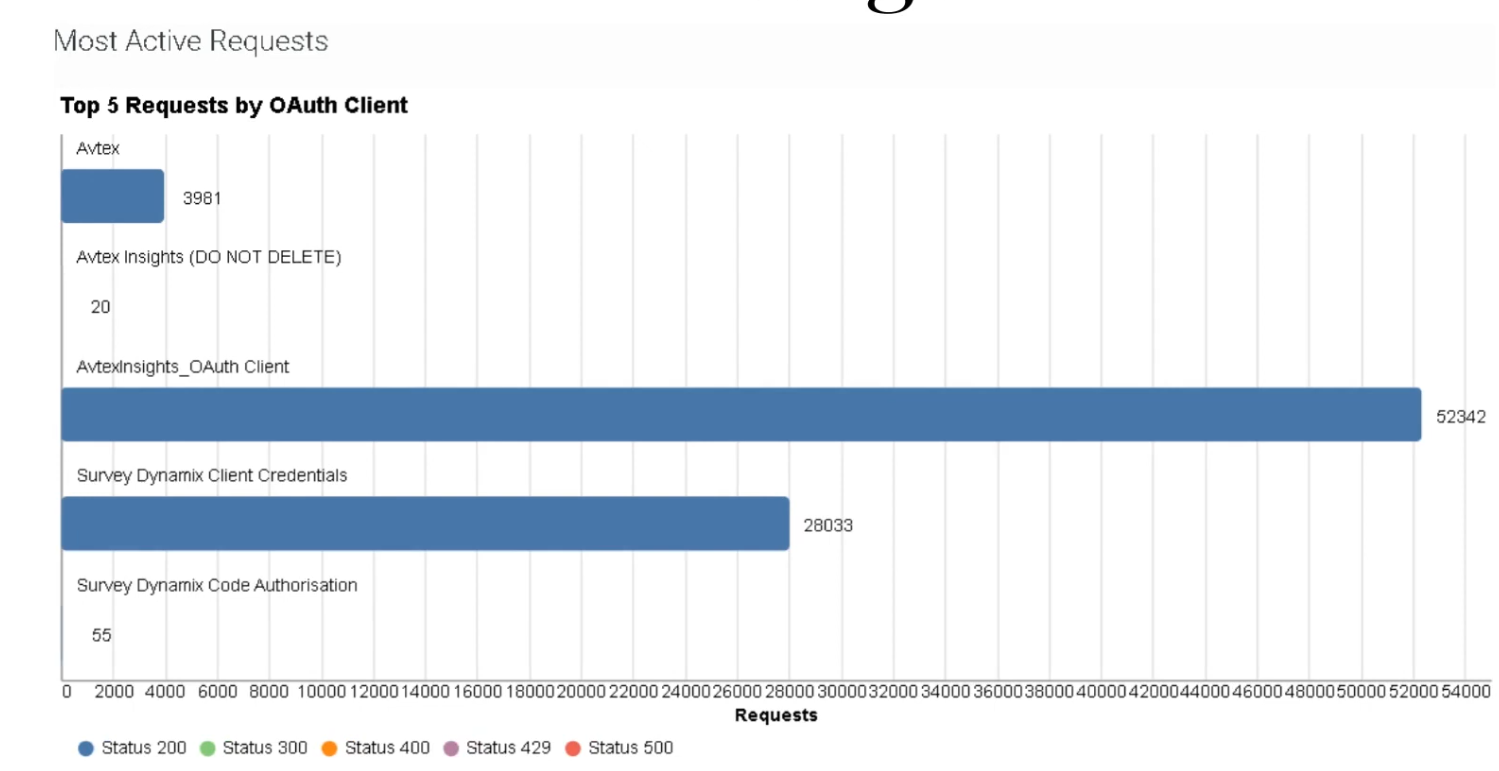
Section 1 — Most Active Requests
Identifies
Top which5 Requests by OAuth clientsClient
Displays the highesttop numberfive ofclients that made the most API requests withinin the selected time period. Helps detectidentify misconfiguredthe integrationsnumber of successful and determinefailed whereAPI optimizationcalls isper needed.
DataExportable can be exported inas CSV format for deeper analysis..
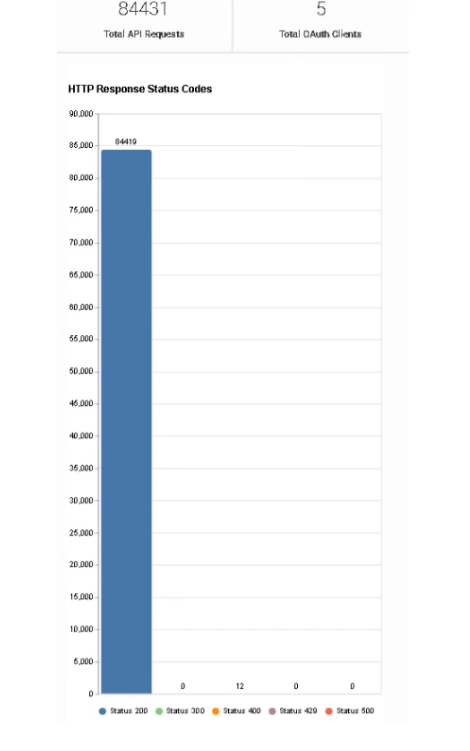
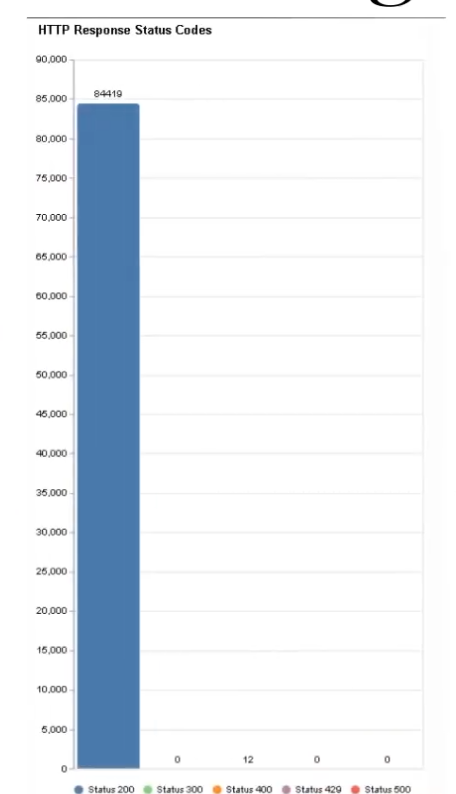
HTTP Response Status Codes
ShowsDisplays the distributiontotal number of HTTPsuccessful responseor failed API calls by status codes— returnedacross byall API calls.clients.
| Status Code | Meaning |
|---|---|
| 200 | |
| 300 | Redirect — user can select a preferred representation |
| 400 | Bad request |
Use⚠️ Note: The documented status codes in thisviewdashboardtoarequickly200,identify300,API400,request failures429, andtroubleshoot500.integrationsCommongeneratingcodeslargelikevolumes401ofanderrors.404 are not broken out separately in this view.
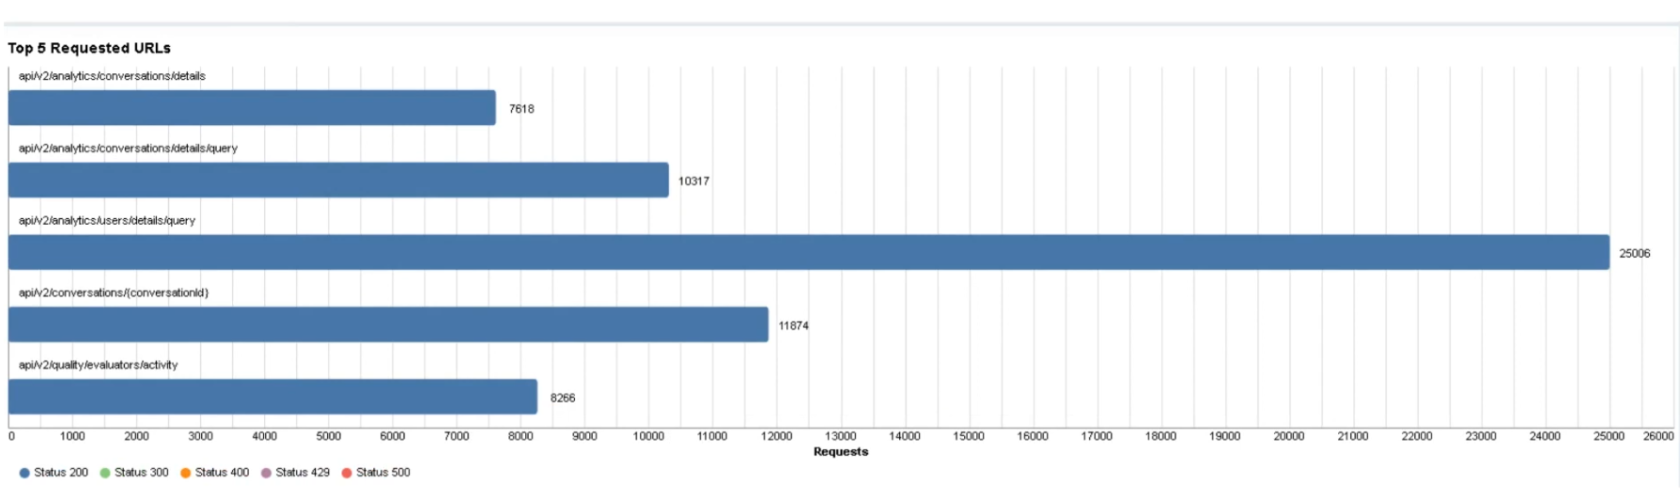
Top 5 Requested URLs
Displays the five API endpoints receiving the highest number of requests. Helps identify endpoints beingwith calledfailed excessivelyAPI orcalls redundantlyand —reduce highunnecessary API traffic. High usage may indicate inefficient polling or integration design.
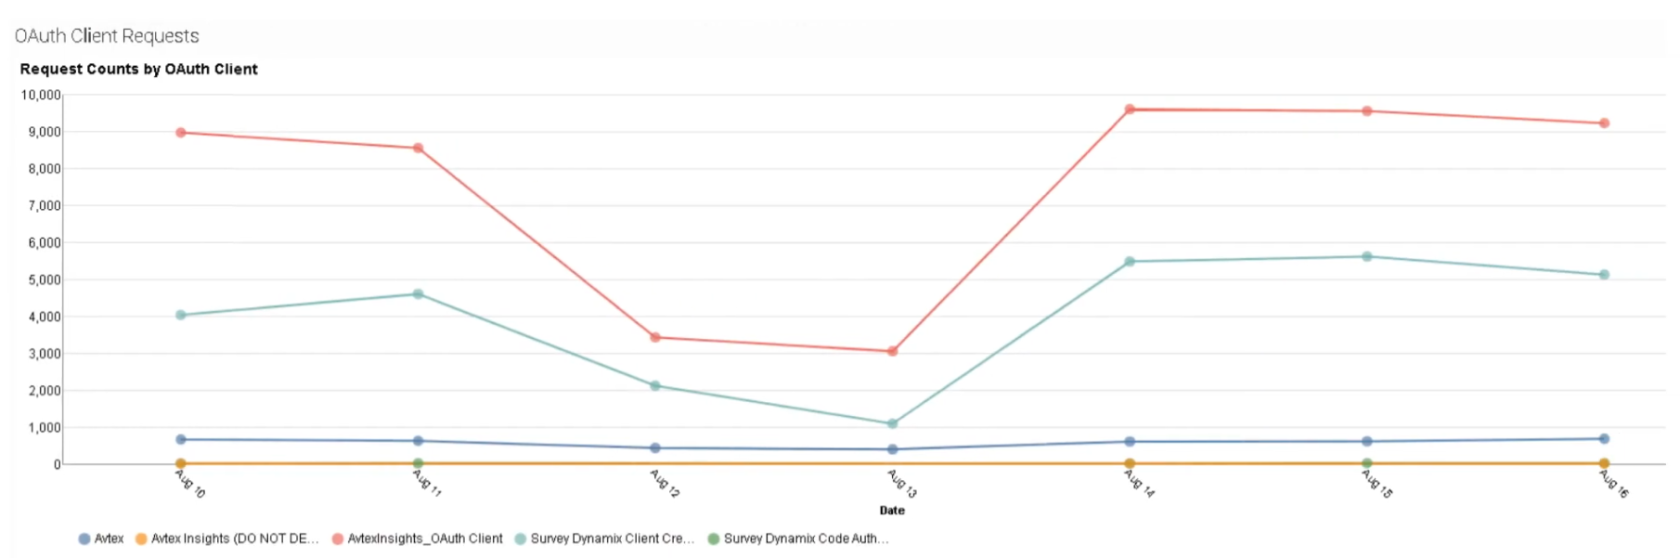
Section 2 — OAuth Client Requests
Request Counts by OAuth Client
Shows howa manycount of API calls eachmade by the selected OAuth client has generatedclients during the selected timeframe. Identifies which integrations are responsible for the most API traffic and helps monitor third-party integration behavior.traffic.
HTTP Response Status Codes — Per Client View
Breaks down successful and failed responses per OAuth client. Useful for diagnosing integration-specific authentication or request issues:
- Many
401400 responses→ authentication problems Many400 errors→ integration sendinginvalidmalformed requests- Many 429 responses → client exceeding rate limits
- Many 500 responses → server-side issue with specific endpoint
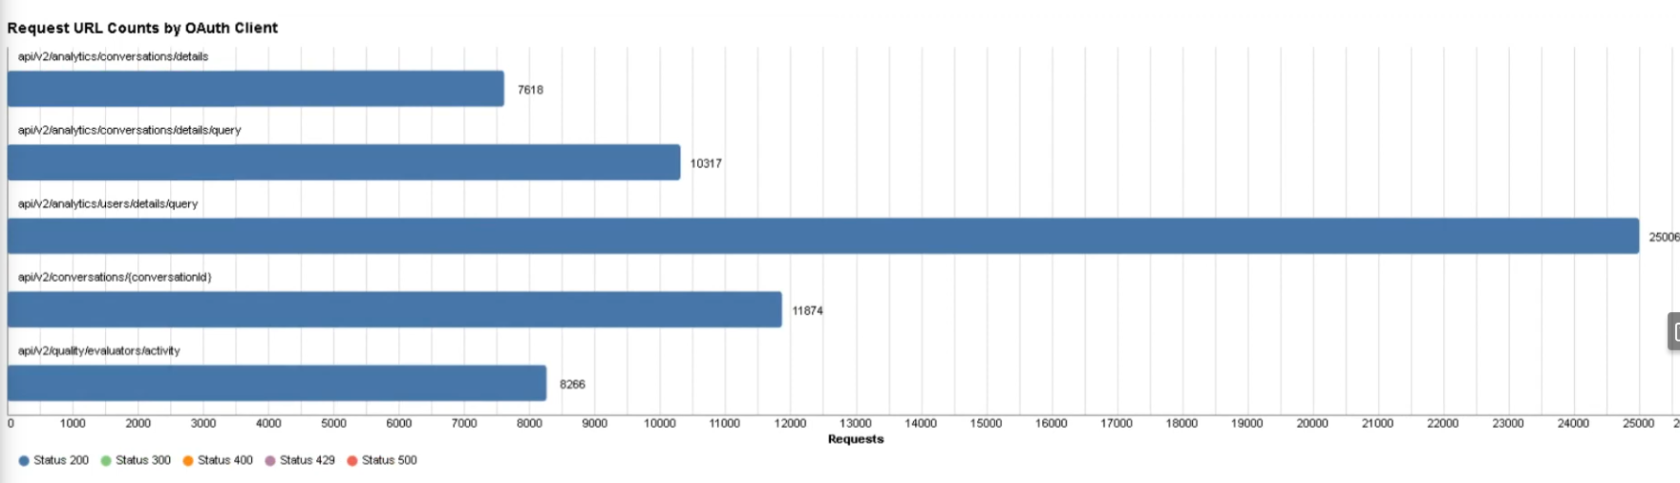
Request URL Counts by OAuth Client
IdentifiesDisplays all URLs that resulted in high API calls per client. Helps identify which APIendpoints endpointseach client is accessing and where failures are beingconcentrated.
by💡
eachClick OAuth Client Settings → Client URL View Selections to specify exactly which OAuthclient.clientsUsefulandforURLsdiagnosingappearAPIinperformancetheseissuesgraphs.orSelectionsintegrationpersistfailures.until manually reset.
Section 3 — URL Requests
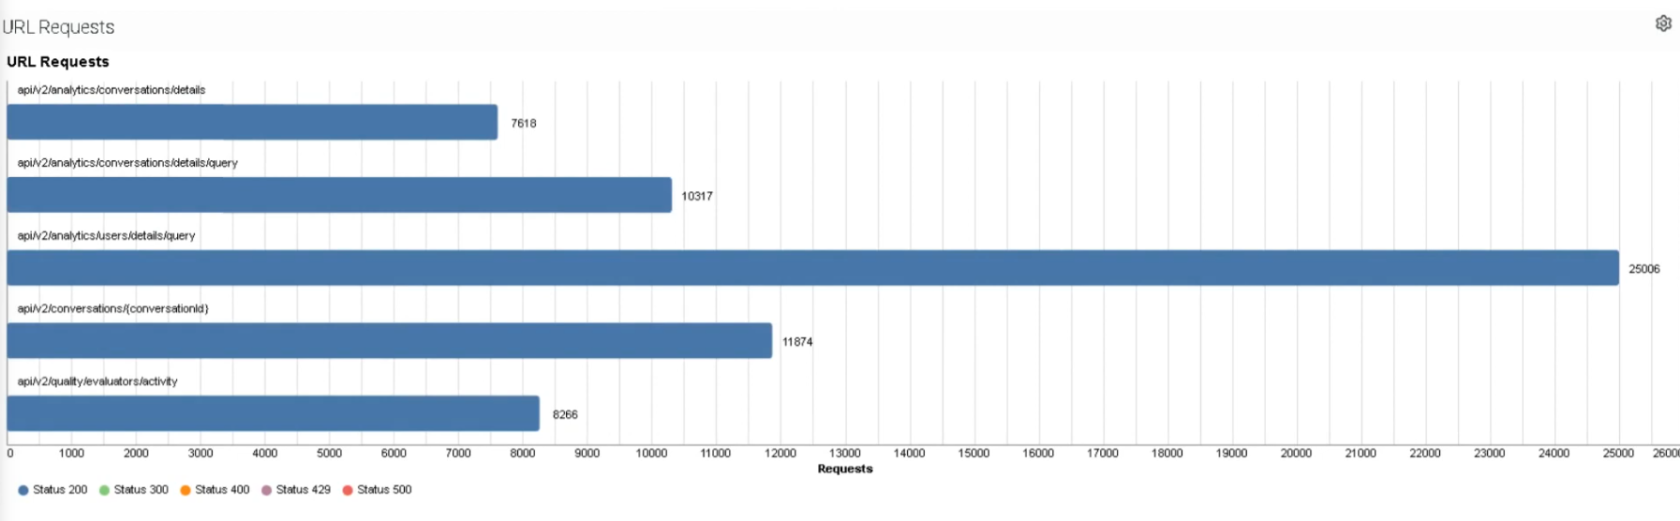
URL Requests (Detail List)
ProvidesDisplays a detailed list of API requests by endpointURL — individual endpoints used, request frequency, and HTTP response outcomes. Helpful for deep analysis of API usage patterns.
💡 Click URL Request Settings → Template URL View Selections to specify which URLs appear in this section's graphs. Selections persist until manually reset.
Total Successful vs. Failed Requests
Summarizes the overall success and failure rates for all API requests. A spike in failed requests may indicate authentication failures, endpoint configuration errors, or integration outages.
Dashboard Panel Summary Table
| Panel | Section | What It Shows |
|---|---|---|
| Top 5 Requests by OAuth Client | Most Active Requests | |
| HTTP Response Status Codes | 200/300/400/ |
|
| Top 5 Requested URLs | Most Active Requests | Most frequently called API endpoints |
| Request Counts by OAuth Client | OAuth Client Requests | Per-client API call counts |
| HTTP Response Status Codes (per client) | OAuth Client Requests | Success/failure breakdown per OAuth client |
| Request URL Counts by OAuth Client | OAuth Client Requests | Which endpoints each client is calling |
| URL Requests | URL Requests | Detailed per-endpoint request list |
| Total Success / Fail | URL Requests | Overall platform request health |
API Usage View (Analytics Workspace)
The API Usage View is a separate tool from the Admin report. Navigate to:
Performance > Workspace > Other > API Usage, orMenu → Analytics → Analytics Workspace → API Usage
The view contains a graph and two main filterable sections:
- OAuth Clients — Lists all clients that made API requests in the selected period. Click a client to cross-highlight its requests in the API Requests section.
- API Requests — Lists all PUT, POST, GET, DELETE calls. Click a request to highlight which clients made it.
Each section has four default columns: client/request name, number of requests, percentage of total requests, and a visual bar. When you apply a filter by clicking a row, a fifth column appears showing the filtered percentage alongside the overall total.
⚠️ You can only filter by one OAuth client or one API request at a time.
⚠️ The graph does not display data when you select a single day as the date range — use multi-day ranges to see the graph.
💡 Click Save to persist your filter and date selections in the view.
Filtering & Export
| Feature | Detail |
|---|---|
| Date Range Presets | Previous 7 days, Previous 30 days, This month, Last month, Previous 3 months |
| Custom Date Range | Configurable start and end date |
| Current Day | Never included — no date range shows today's data |
| Export | Click Export API Usage Data → downloads CSV |
| OAuth Client Filter | Click OAuth Client Settings to select specific clients for Section 2 graphs |
| URL Filter | Click URL Request Settings to select specific endpoints for Section 3 graphs |
| Save View Settings | Available in the API Usage View — persists filter and date selections |
Best Practices
| Practice | Reason |
|---|---|
| Monitor API usage regularly | Prevent exceeding fair use limits |
| Limit unnecessary API calls | Improve platform performance |
| Use caching strategies | Reduce repeated requests to the same endpoint |
| Optimize integration polling intervals | Avoid excessive traffic from scheduled jobs |
| Investigate 429 errors immediately | Rate limiting can break integrations silently |
| Monitor failed API requests | Detect integration issues |
Troubleshooting
| Issue | Cause | Resolution |
|---|---|---|
| Excessive API usage | Integration polling too frequently | Adjust polling interval or add caching |
| High |
Verify endpoint |
|
| Unknown API traffic | Investigate OAuth Admin → Integrations → OAuth |
|
| Data appears on wrong date | UTC vs. local time zone offset | Remember report dates are calculated in UTC |
| Graph not showing in View | Single day selected as date range | Select a multi-day date range to display the graph |
InterviewExam Cheat Sheet
| Question | Answer |
|---|---|
| What does the API Usage |
API request activity across integrations and OAuth clients |
| What HTTP methods are tracked? | GET, POST, PUT, DELETE |
| What |
|
| What |
Too many requests — rate limiting triggered |
| Does |
No — |
| What |
UTC — displayed in local time, but calculated in UTC |
| What is excluded from the report? | Internal Genesys UI requests, outbound Data Actions to external platforms, and all embedded clients (Chrome, Firefox, Salesforce, Zendesk) |
| Are Embeddable Framework apps tracked? | Yes — they are subject to API usage allocations |
| What permission is required? | OAuth > Client > View |
| What are the two tools for API usage monitoring? | Admin Report (Admin → Platform Usage → API Usage) and Analytics View (Performance > Workspace > Other > API Usage) |
| What happens to the graph when you select 1 day in the View? | The graph does not display — use a multi-day range |
| What does the OAuth Client Settings button do? | Filters which clients and URLs appear in the |
| Where is the second Admin navigation path? | Menu |
See Also
- Fair Use Policy for APIs — limits that this report helps you monitor against
- Roles & Permissions —
OAuth > Client > Viewpermission details - About Platform Usage — broader platform consumption monitoring
- Resource Usage on Your Invoice — billing alignment with UTC usage calculations