Platform Usage — API Usage
| Section | Description |
|---|---|
| Module Context | API Usage is part of Platform Usage monitoring in Genesys Cloud Administration. |
| Purpose | Allows administrators to monitor API request consumption, client activity, and request failures. |
| Primary Goal | Track API usage to stay within the Genesys Cloud Fair Use Policy and troubleshoot integration issues. |
| Admin Location | Admin → Platform Usage → API Usage |
Study Notes
| Topic | Explanation |
|---|---|
| API Usage View | Displays how many API requests your contact center makes and which clients are generating those requests. |
| Fair Use Monitoring | Helps administrators identify excessive API usage that may violate Genesys Cloud API fair use limits. |
| Request Types Tracked | Includes PUT, POST, GET, and DELETE API calls. |
| Data Sources Included | Requests from integrations, third-party apps, AppFoundry applications, and Data Actions calling the Genesys Cloud public API. |
| Internal Requests Excluded | Does NOT include API calls made by the Genesys Cloud browser UI or mobile app. |
| Embedded Clients Excluded | Requests from Genesys Cloud for Chrome, Firefox, Salesforce, or Zendesk are not included. |
Navigation
| Task | Navigation |
|---|---|
| View API Usage | Admin → Platform Usage → API Usage |
| Filter by Date | Use Date Range Filter |
| Export Data | Click Export (CSV) in Most Active Requests section |
API Usage Dashboard Panels
Overview Panel
The API Traffic & Request Analytics dashboard provides a centralized view of how APIs are being used within the Genesys Cloud organization — request volume, client activity, endpoint usage, and response outcomes.
![]()
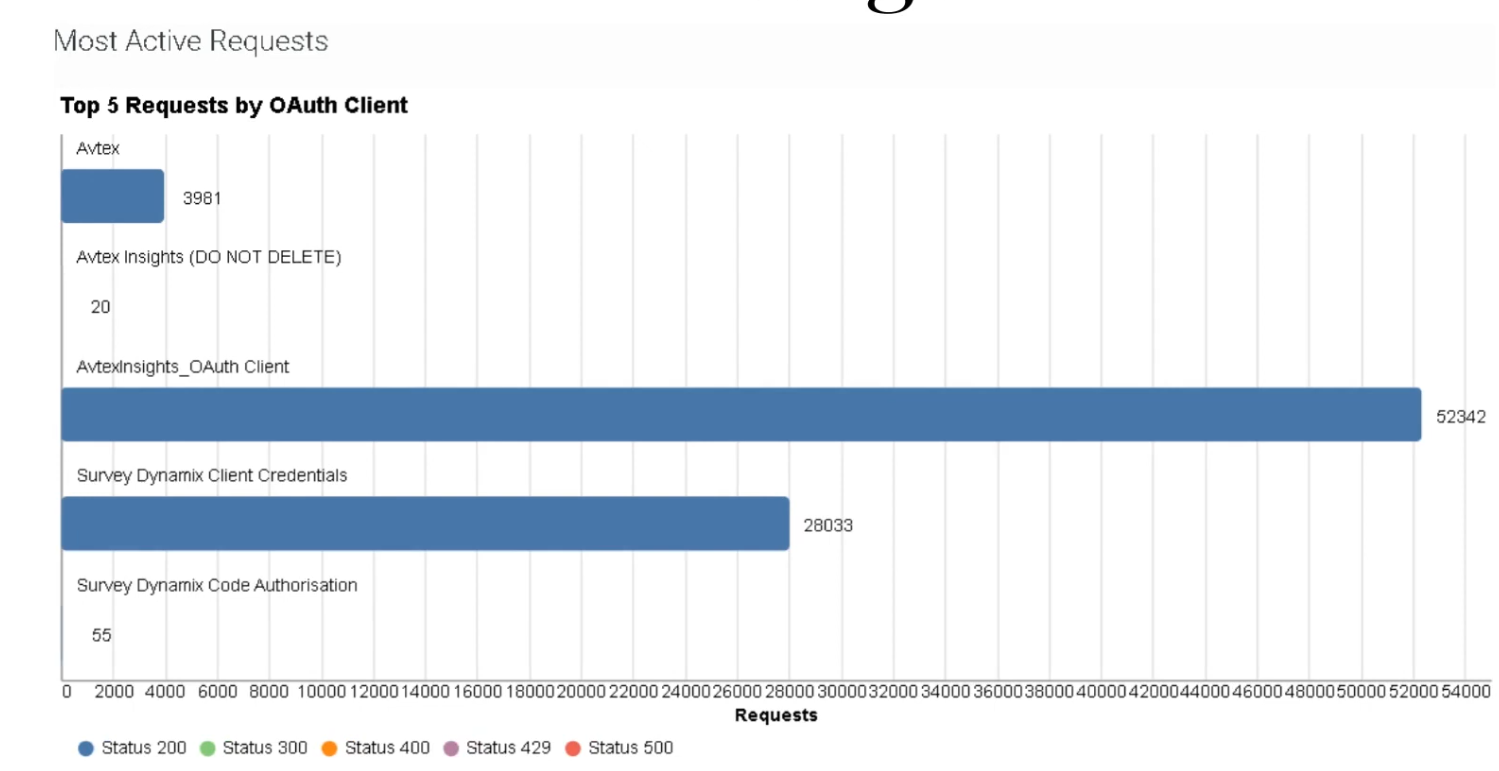
Most Active Requests
Identifies which OAuth clients or integrations generate the highest number of API requests within the selected time period. Helps detect misconfigured integrations and determine where optimization is needed.
Data can be exported in CSV format for deeper analysis.
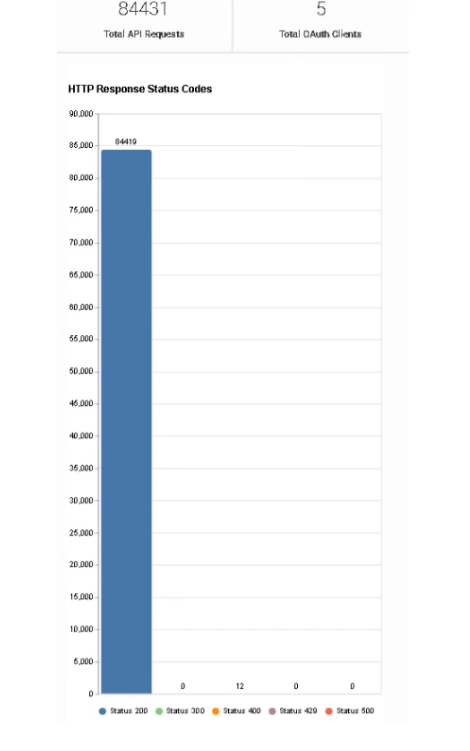
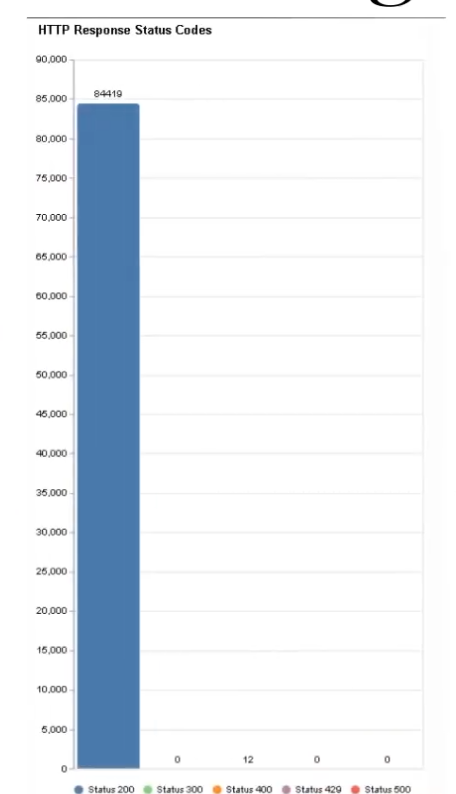
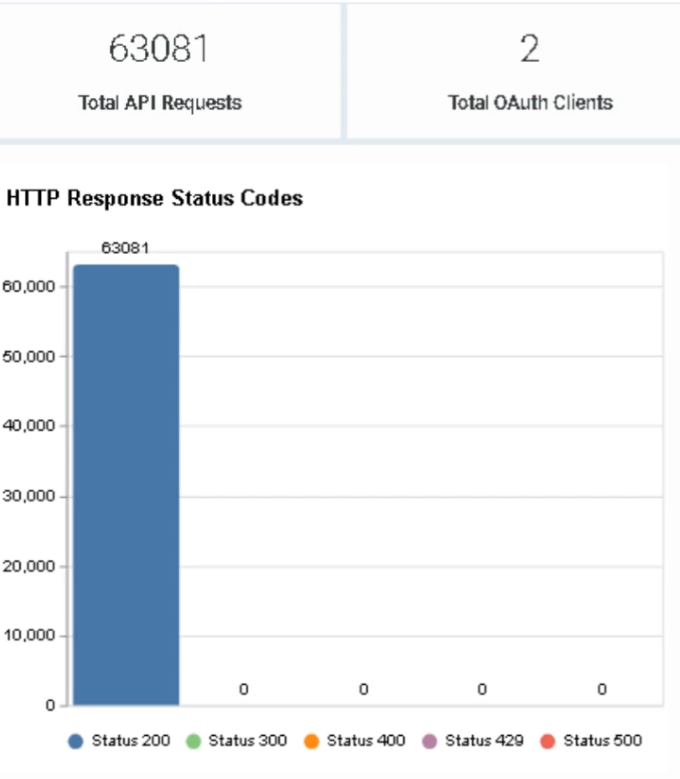
HTTP Response Status Codes
Shows the distribution of HTTP response status codes returned by API calls.
| Status Code | Meaning |
|---|---|
| 200 | Successful request |
| 400 | Bad request (client error) |
| 401 | Unauthorized request |
| 404 | Endpoint not found |
| 500 | Server-side error |
Use this view to quickly identify API request failures and troubleshoot integrations generating large volumes of errors.
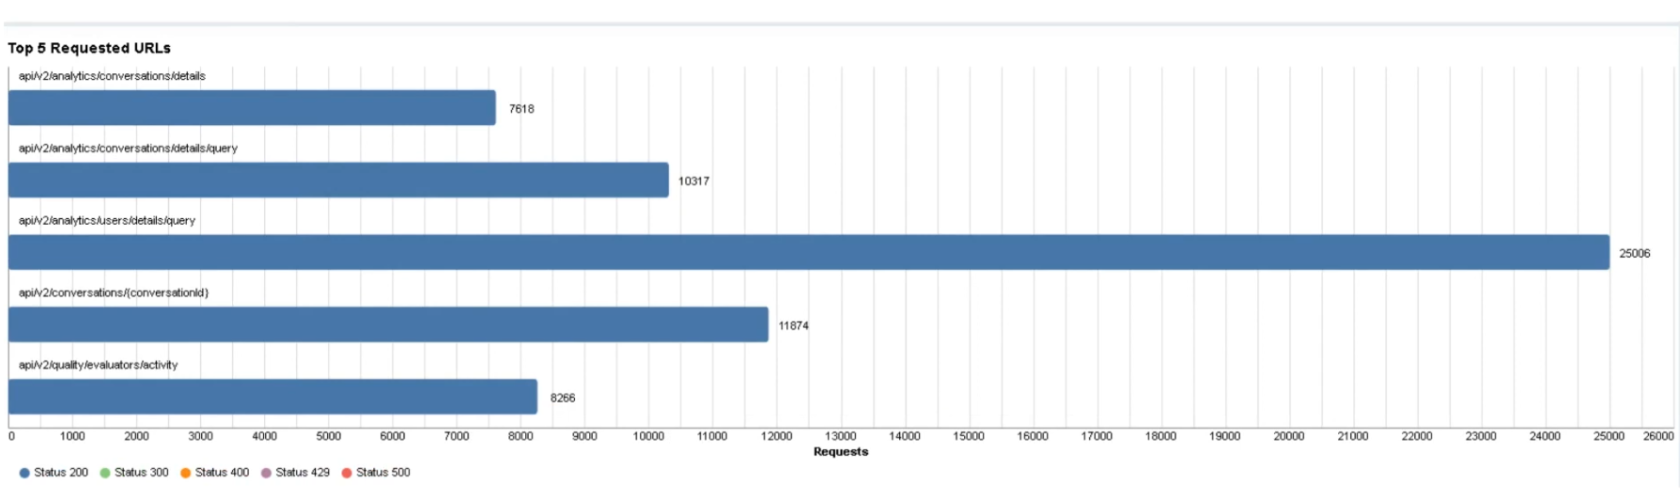
Top 5 Requested URLs
Displays the five API endpoints receiving the highest number of requests. Helps identify endpoints being called excessively or redundantly — high usage may indicate inefficient polling or integration design.
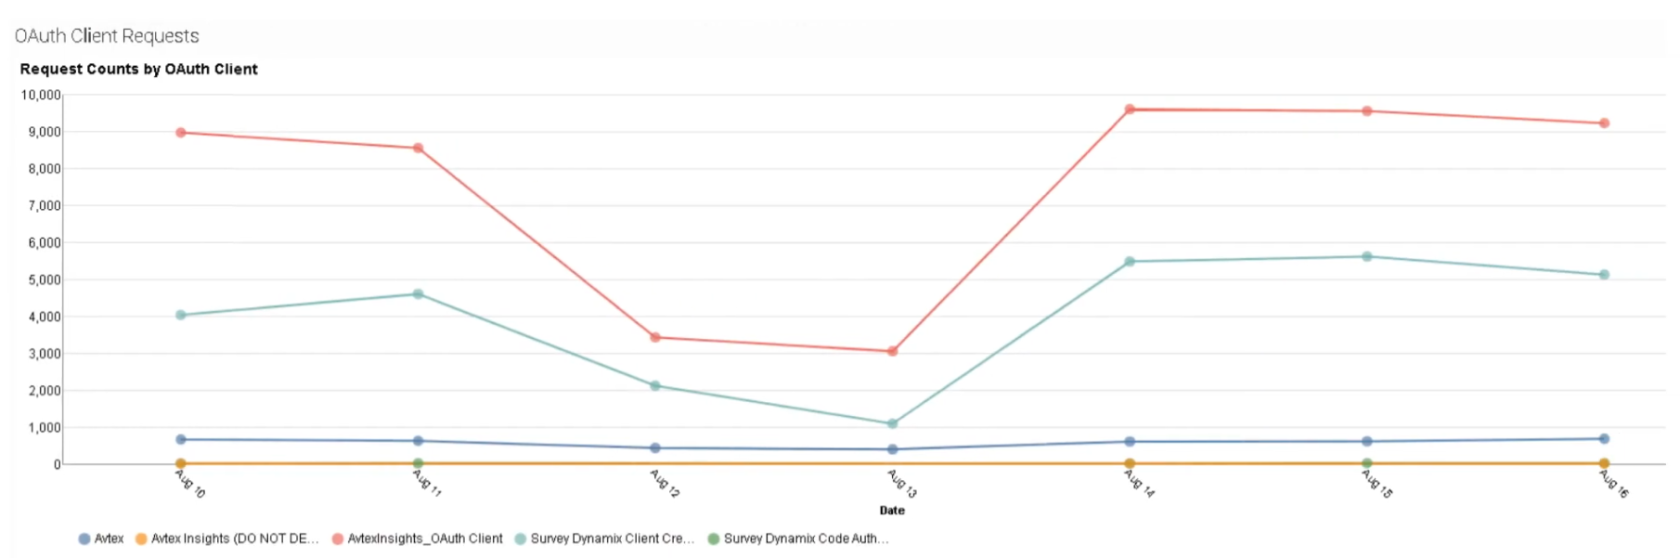
OAuth Client Requests
Shows how many API calls each OAuth client has generated during the selected timeframe. Identifies which integrations are responsible for most API traffic and helps monitor third-party integration behavior.
HTTP Response Status Codes — Per Client View
Breaks down successful and failed responses per OAuth client. Useful for diagnosing integration-specific issues:
- Many 401 responses → authentication problems
- Many 400 errors → integration sending invalid requests
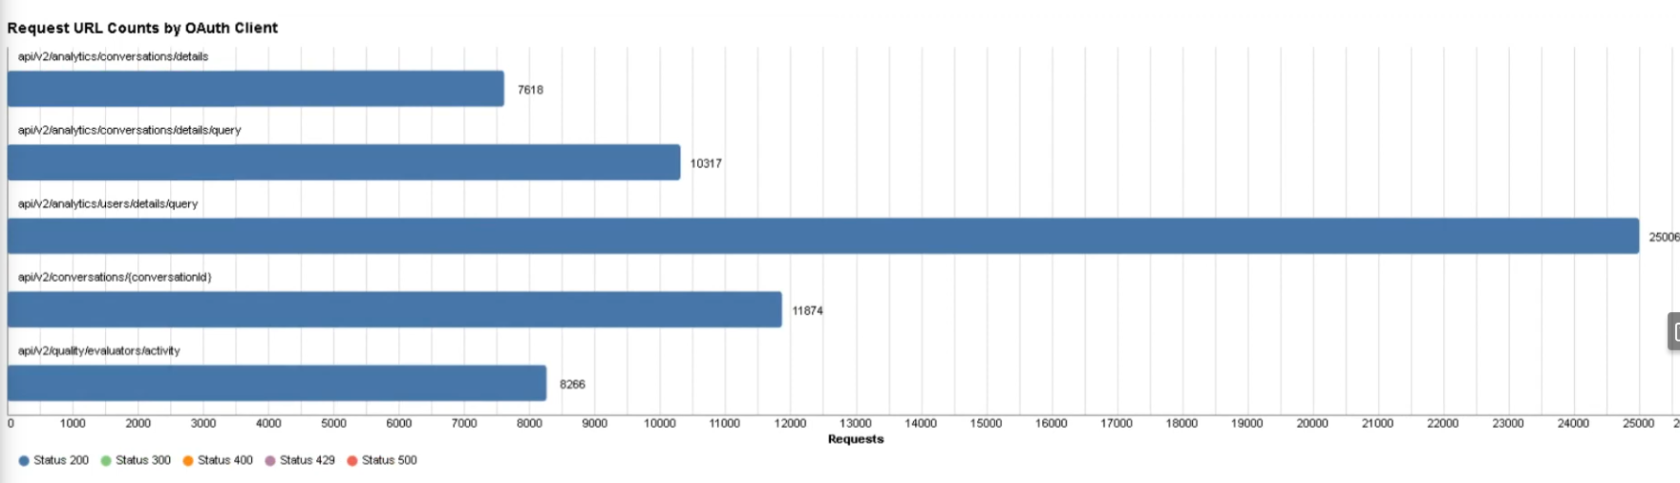
Request URL Counts by OAuth Client
Identifies which API endpoints are being accessed by each OAuth client. Useful for diagnosing API performance issues or integration failures.
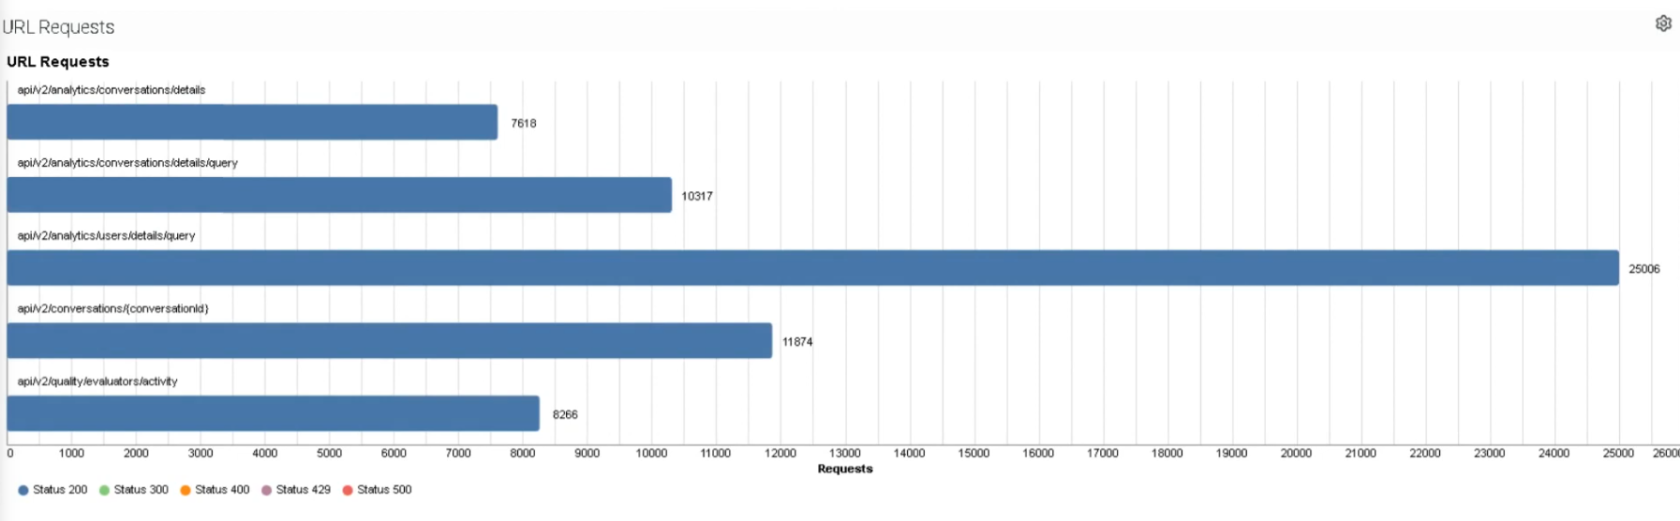
URL Requests (Detail List)
Provides a detailed list of API requests by endpoint — individual endpoints used, request frequency, and HTTP response outcomes. Helpful for deep analysis of API usage patterns.
Total Successful vs. Failed Requests
Summarizes the overall success and failure rates for all API requests. A spike in failed requests may indicate authentication failures, endpoint configuration errors, or integration outages.
Dashboard Summary Table
| Panel | What It Shows |
|---|---|
| Most Active Requests | OAuth clients / integrations with highest request volume |
| HTTP Response Status Codes | Distribution of 200/400/401/404/500 responses across all calls |
| Top 5 Requested URLs | Most frequently called API endpoints |
| OAuth Client Requests | Per-client API call counts |
| Response Codes per Client | Success/failure breakdown per OAuth client |
| URL Counts by OAuth Client | Which endpoints each client is calling |
| URL Requests | Detailed per-endpoint request list |
| Total Success / Fail | Overall platform request health at a glance |
Best Practices
| Practice | Reason |
|---|---|
| Monitor API usage regularly | Prevent exceeding fair use limits |
| Limit unnecessary API calls | Improve platform performance |
| Use caching strategies | Reduce repeated requests |
| Optimize integration polling intervals | Avoid excessive traffic |
| Monitor failed API requests | Detect integration issues early |
Troubleshooting
| Issue | Cause | Resolution |
|---|---|---|
| Excessive API usage | Integration polling too frequently | Adjust polling interval |
| High failure rate | Incorrect API endpoint | Verify endpoint configuration |
| Authentication errors | Invalid OAuth token | Regenerate OAuth credentials |
| API limit warnings | Excessive requests | Optimize API calls |
| Unknown API traffic | Unauthorized integration | Investigate OAuth client |
Interview Cheat Sheet
| Question | Answer |
|---|---|
| What does the API Usage dashboard show? | API request activity across integrations and OAuth clients |
| What HTTP methods are tracked? | GET, POST, PUT, DELETE |
| What is the purpose of API monitoring? | Track usage, detect failures, and prevent exceeding API limits |
| Does API usage include internal Genesys Cloud requests? | No — internal UI and embedded client requests are excluded |
| What integrations appear in the dashboard? | OAuth clients, third-party integrations, AppFoundry apps, and Data Actions calling the public API |